Most content reports are full of numbers… Traffic. Pageviews. Rankings. Engagement time. Clicks. Scroll depth. Conversions. Bounce rates. Impressions. Assisted conversions. Social shares. Backlinks.
All of those numbers can be useful. They can also become noise.
The problem with many content analytics reports is not that they lack data. The problem is that they do not clearly answer the most important question:What should we improve next?
That is the real purpose of content analytics metrics. They should help you make better decisions about your content. They should show you what people need, where they get stuck, which pages are fading, and which content deserves more attention.
If a metric does not help you make a smarter decision, it may not be worth staring at every month.
At Click Laboratory, we believe content analytics should support living content, content that is watched, measured, improved, and refreshed over time. The goal is not to publish a page, check a box, and move on. The goal is to keep learning from the people who use your content so the content becomes more useful over time.
That changes how you think about metrics.
Instead of asking, “How many pageviews did this get?” you start asking better questions.
- Can people find this content?
- Does it help them?
- Does it move them forward?
- Is it getting stronger or weaker?
Those four questions are the foundation of useful content analytics.
The Point Is Not More Data, It Is Better Decisions
A good content analytics metric should help you do something.
It should help you improve a title. Rewrite an introduction. Refresh outdated information. Add a clearer example. Strengthen internal links. Improve a call to action. Create a supporting article. Repurpose a strong idea. Merge overlapping pages. Fix a page that is losing search visibility.
Metrics should lead to movement.
This matters because content teams often fall into the trap of reporting instead of improving. They collect the same numbers each month, put them into a dashboard, talk about whether traffic is up or down, and then move on to the next publishing deadline.
That is not a content analytics strategy.
That is just reporting.
A stronger approach is to use metrics as signals. Each number should help you understand whether the content is doing its job, and if not, why not.
For example, if a page has high search impressions but low clicks, the problem may not be the content itself. The problem may be the title, meta description, or search result positioning.
If a page gets traffic but people leave quickly, the problem may be the opening, the structure, or a mismatch between what the page promised and what the reader found.
If a page gets strong engagement but few conversions, the content may be helpful, but the next step may be wrong.
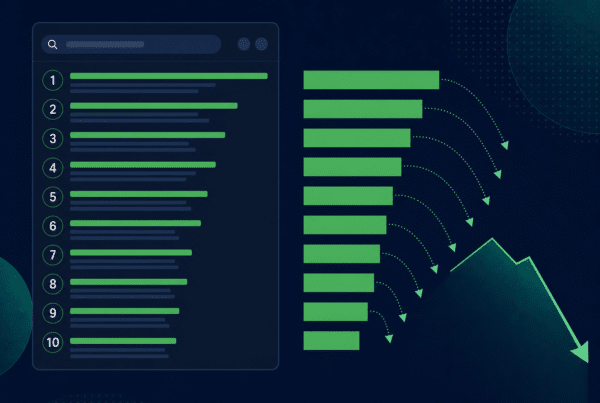
If a page used to rank and now it does not, you may be dealing with content decay.
The numbers are not the answer.
They point you toward the answer.
The Four Questions Your Content Analytics Metrics Should Answer
You do not need to track every possible content metric. You need to track the metrics that help you make better decisions.
The easiest way to do that is to organize your metrics around four questions.
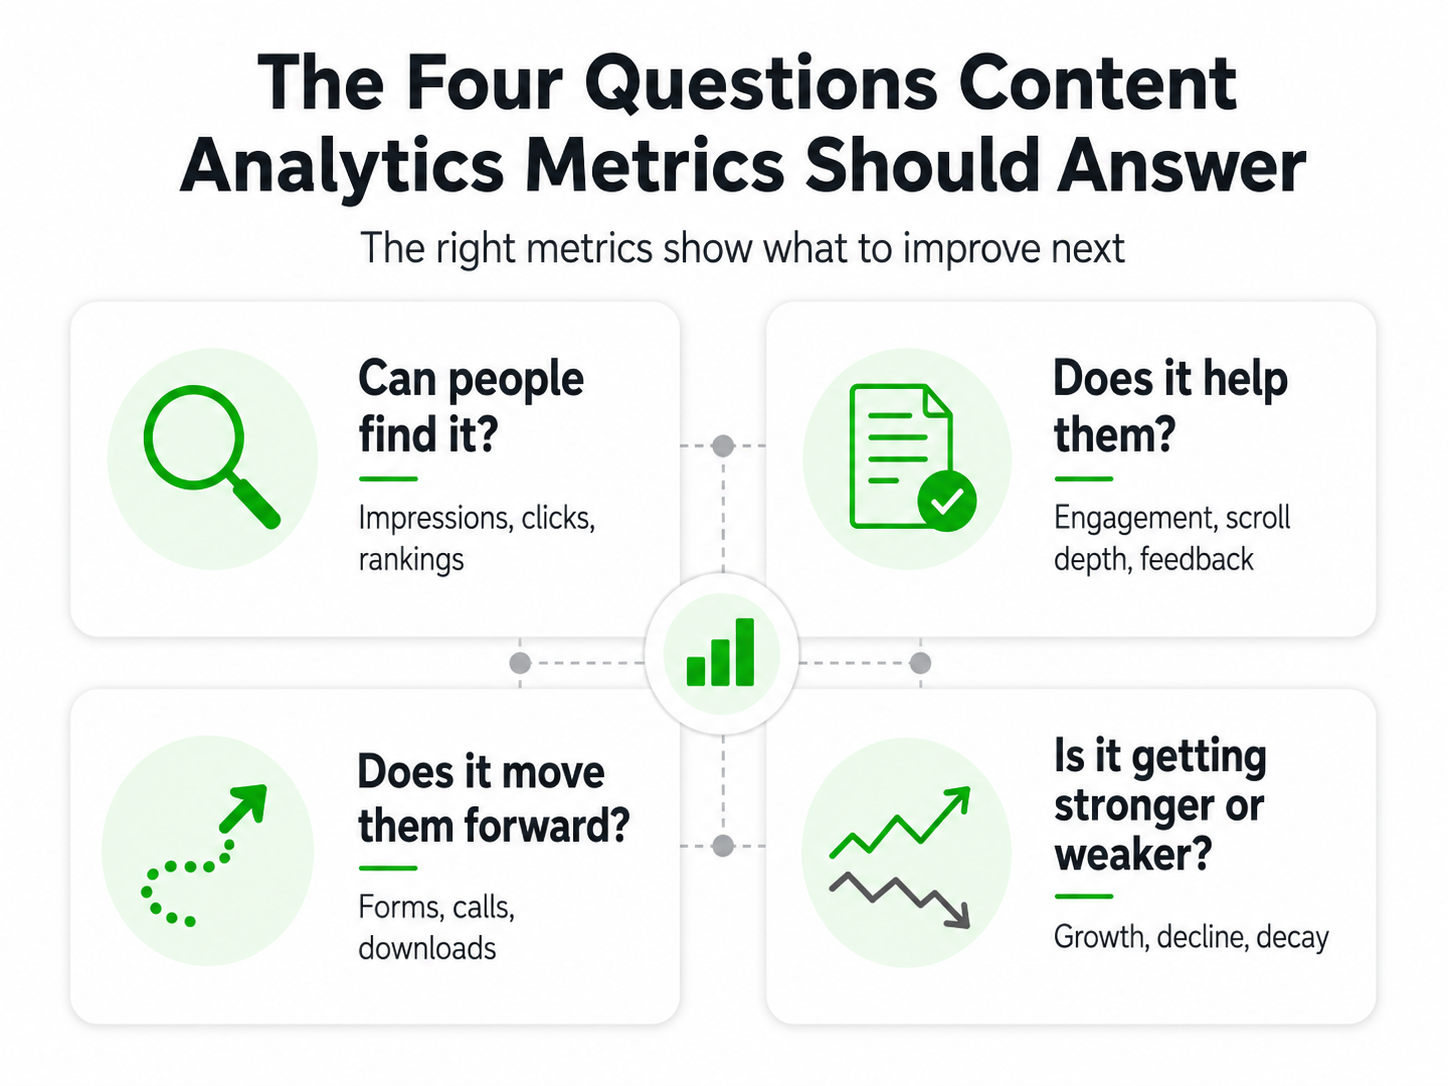
1. Can people find the content?
This question is about visibility. Before content can help anyone, people have to discover it.
For search focused content, visibility metrics help you understand whether your page is appearing for the right searches, earning clicks, and staying competitive. This connects directly to SEO, because strong content still needs to be findable. Click’s own SEO philosophy says that more content does not automatically mean more traffic. Strong content, well promoted, is what drives traffic.
Useful visibility metrics include:
- Search impressions
- Organic clicks
- Average ranking position
- Click through rate from search
- Indexed pages
- Backlinks
- Internal links
- Referral traffic
- Email clicks
- Social traffic
- AI search mentions or citations, when available
The key is not simply whether the page is visible. The key is whether it is visible to the right people for the right searches.
A page can bring in traffic and still not help the business. It may rank for a broad informational query that attracts people who will never become customers. On the other hand, a lower traffic page may be extremely valuable if it attracts people who are closer to making a decision.
So when you look at visibility, do not just ask, “Did traffic increase?”
Ask, “Are the right people finding this page, and are they finding it for the right reasons?”
2. Does the content help them?
Finding the page is only the beginning.
The next question is whether the page actually helps the person who lands there.
This is where many content reports are too shallow. They show that someone visited the page, but they do not tell you whether the person found the answer useful.
Engagement metrics can help.
Useful engagement and usefulness metrics include:
- Engagement time
- Scroll depth
- Internal link clicks
- Video completion rate
- FAQ interactions
- Heatmap behavior
- Session recordings
- Return visits
- Comments or replies
- On page survey responses
- Sales team feedback
- Support questions
These metrics help you see whether people are staying with the content, using it, and moving through it in a meaningful way.
But be careful. Engagement metrics need interpretation.
A long time on page may mean someone is deeply engaged. It may also mean the page is confusing. A short time on page may mean the content failed. It may also mean the reader got a quick answer and left satisfied.
That is why content analytics should combine numbers with human insight.
If users are not scrolling far enough to reach your best section, maybe the introduction is too slow. If they keep clicking the same FAQ, maybe that topic deserves its own article. If sales keeps answering the same question manually, maybe your content is not doing enough before the call.
This is also where your existing article on using content analytics to improve customer experience fits naturally. Content analytics should help you reduce confusion, improve clarity, and make the next step easier for the reader.
3. Does the content move them forward?
Helpful content should create movement.
That movement does not always mean an immediate sale. Sometimes the right next step is reading another article. Sometimes it is watching a video. Sometimes it is downloading a guide. Sometimes it is signing up for email. Sometimes it is filling out a form, calling, scheduling a consultation, or asking for help.
Content analytics helps you understand whether the content is leading people toward the next useful step.
Useful movement and conversion metrics include:
- Form submissions
- Phone calls
- Newsletter signups
- Guide or checklist downloads
- Demo requests
- Quote requests
- Appointment bookings
- Internal link clicks to service pages
- Assisted conversions
- CRM influenced contacts
- Pipeline influenced
- Revenue influenced
This is where content analytics connects to conversion optimization.
A page may attract the right audience and provide helpful information, but still fail to move people forward because the call to action is wrong.
For example, a top-of-funnel article may not be the right place to ask someone to schedule a consultation immediately. The reader may still be learning. A softer next step, such as a checklist, related guide, or email signup, may fit better.
On the other hand, a service page may need a stronger direct call to action because the visitor is much closer to deciding.
This is why content analytics should not live in a silo. It should connect to conversion optimization, SEO, customer experience, and the full buyer journey.
The right metric depends on the job of the page.
- An educational article should help someone understand.
- A comparison page should help someone evaluate.
- A case study should help someone trust.
- A service page should help someone take action.
When you know the job of the page, you can measure whether it is doing that job.
4. Is the content getting stronger or weaker?
This is one of the most important questions in content analytics.
Content performance is not fixed.
A page is usually moving in one of two directions. It is either gaining strength or losing it. It may be earning more impressions, better rankings, stronger engagement, more conversions, and more internal links.
Or it may be slipping.
That decline is content decay. Useful decay metrics include:
- Declining organic clicks
- Declining search impressions
- Lower average ranking position
- Lower click through rate
- Declining engagement time
- Lower scroll depth
- Fewer conversions
- Fewer assisted conversions
- Lost featured snippets or search features
- Lost backlinks
- Outdated sections
- Competitors with stronger content
- Search intent changes
Decay metrics matter because they show you which content needs attention before it becomes invisible.
A page that has dropped from position 4 to position 11 may still be close enough to recover. A page with backlinks and history may be easier to improve than starting from nothing. A page with steady impressions but falling clicks may only need a better title and meta description.
This is where content analytics supports living content.
You are not waiting until a page is dead.
You are watching for signs of decline, diagnosing the cause, and improving the page while it still has value.
Vanity Metrics to Be Careful With
Some metrics are not bad, but they become dangerous when they are treated as the whole story.
Pageviews are a good example.
It feels good when pageviews go up. But pageviews do not tell you whether the visitors were qualified, whether the content helped them, or whether they moved closer to action.
Keyword rankings can also be misleading. Ranking for a keyword that does not matter to your business may not help much. Losing a ranking for a low value keyword may not be a major problem. Gaining visibility for a high intent keyword, even with lower search volume, may matter much more.
Social likes can be useful, but they do not always indicate business value. A post can get attention without attracting the right audience or supporting a meaningful next step.
Average engagement time can also mislead if you do not understand the context. Long engagement may be good, but not always. Short engagement may be bad, but not always.
The point is not to ignore these metrics.
The point is to stop treating them as final answers.
Good content analytics asks what the metric means and what you should do because of it.
How to Turn Metrics Into Content Improvements
The best content analytics reports help you take action.
Here are a few common patterns and what they may mean.
High impressions, low clicks
If a page is showing up in search but not getting clicks, the title may not be strong enough. The meta description may not be clear. The page may not look as useful as the other results. Or the content may be appearing for searches that are not a strong fit.
What to improve:
- Rewrite the title to better match intent
- Improve the meta description
- Make the opening promise clearer
- Check whether the page is targeting the right query
Traffic, but low engagement
If people click but do not stay, the page may not be meeting expectations.
What to improve:
- Rewrite the introduction
- Move the clearest answer higher on the page
- Improve headings and scannability
- Add examples
- Remove unnecessary buildup
Strong engagement, but few conversions
If people are reading but not acting, the content may be helpful, but the next step may be weak or mismatched.
What to improve:
- Add a more relevant call to action
- Offer a softer next step
- Link to a related service page
- Add trust signals
- Clarify what the reader should do next
Declining traffic and rankings
If a page is losing visibility over time, do not rewrite blindly. First, study the current search results.
What to improve:
- Check whether search intent has changed
- Compare the page against current ranking competitors
- Update outdated information
- Add missing sections
- Strengthen internal links
- Improve the title and structure
- Consider whether the page should be refreshed, rebuilt, merged, or redirected
Good conversions, but low traffic
This is often one of the best opportunities.
If a page converts well but not enough people see it, the page may deserve more visibility.
What to improve:
- Add internal links from related articles
- Create supporting content around the topic
- Promote the page by email or social
- Improve SEO targeting
- Repurpose the message into other formats
This is exactly why content analytics should be connected to your broader SEO strategy and conversion strategy. The goal is not only to get more people to a page. The goal is to get the right people to the right page and help them take the right next step.
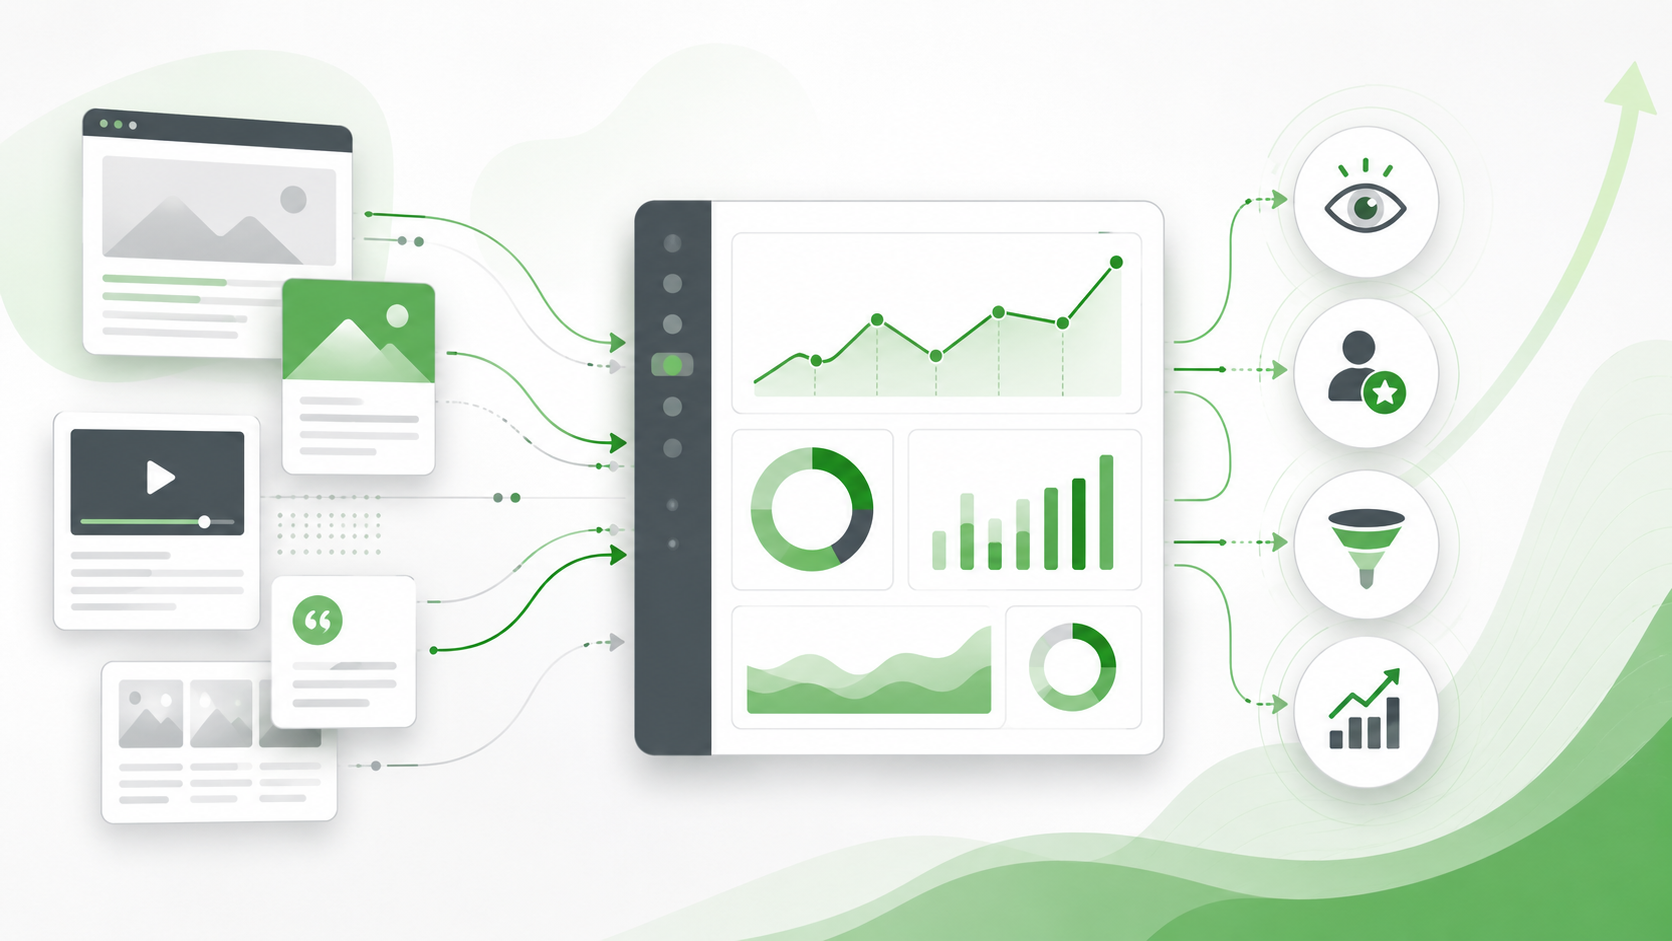
The Living Content Scorecard
One simple way to make content analytics more useful is to score important pages using the four questions we have covered.
You do not need a complicated scoring system. Start with a simple 1 to 5 rating for each category.
- Visibility: Can the right people find this page?
- Usefulness: Does this page clearly help the reader?
- Movement: Does this page lead to the right next step?
- Strength: Is this page gaining value or losing value over time?
A page with strong visibility but weak movement may need a better CTA.
A page with low visibility but strong conversions may need more internal links and promotion.
A page with declining strength may need a content refresh.
A page with weak usefulness may need a deeper rewrite.
This kind of scorecard keeps your content analytics practical. It turns a dashboard into a decision making tool.
It also supports the idea of living content. You are not treating pages as finished. You are watching them, learning from them, and improving them over time.
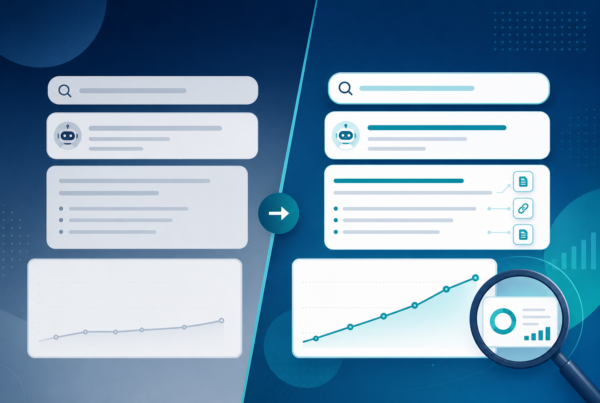
Where AI Search and AEO Fit Into Content Analytics Metrics
Content analytics is changing because search behavior is changing.
People still use Google, but they also get answers from AI tools, AI search results, voice assistants, YouTube, LinkedIn, newsletters, communities, and other sources. That means content performance cannot only be measured by traditional organic traffic.
This is where AEO, or answer engine optimization, becomes part of the conversation.
For AEO, you may want to watch whether your content is clear enough to be used in answer based experiences. You may also want to monitor whether your brand or content is being mentioned, cited, or summarized in AI search results.
These metrics are still developing, but the principle is not new.
Clear, helpful, specific content is easier for people to understand. It is also easier for search engines and answer engines to interpret.
That is why Click’s article on staying visible in search and AI answers is so closely connected to content analytics. If content is easy to create, then visibility depends more on usefulness, clarity, authority, and original value.
Content analytics can help you see whether your pages are moving in that direction.
What to Ignore, at Least at First
When you are just getting started, do not try to measure everything.
Start with the pages that matter most.
Look at pages that already drive traffic, leads, sales conversations, customer education, or important search visibility. Look at pages that used to work but are now fading. Look at pages that support services you want to grow.
Then focus on the metrics that help you make decisions.
You can ignore metrics that do not change what you do.
You can ignore reports that look impressive but do not reveal a next step.
You can ignore vanity wins that do not connect to usefulness, visibility, movement, or content strength.
Content analytics should make your work clearer, not heavier.
Final Thought, Measure What Helps You Serve People Better
Content analytics metrics are not there to make a report look complete.
They are there to help you create better content.
Better content is easier to find. It answers the reader more clearly. It helps people move forward. It stays useful over time. It supports search visibility, AI visibility, customer experience, and conversion.
That is why the best content analytics metrics are not just numbers.
They are signals.
They show you what people need, where content is falling short, and what should be improved next.
When you use those signals well, your content stops being static. It becomes living content.
And living content keeps getting better.
Need Help Knowing Which Content Metrics Actually Matter?
If your team is tracking content performance but still unsure what to improve, Click Laboratory can help.
We can review your content, identify the pages with the most opportunity, find signs of content decay, and build a practical living content plan that connects analytics to better decisions.