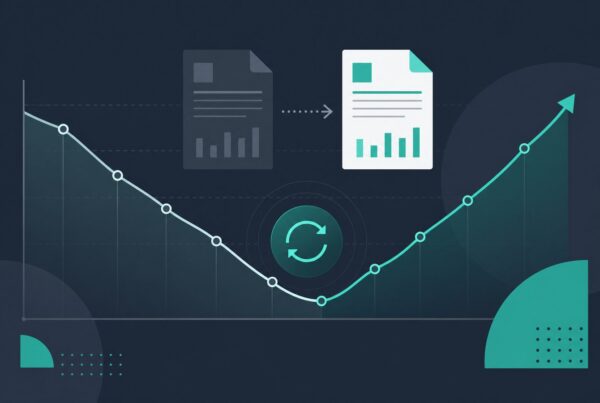
Your metrics dashboard can look healthy while individual URLs quietly lose ground. Site-wide traffic holds. A few heroes spike. Meanwhile, a cluster of posts that used to feed pipeline shows fewer impressions, softer click-through, and shorter on-page engagement. The question marketing leaders ask in that moment is simple: what metrics show content decay vs growth? Not every dip is decay. Not every green cell means momentum you can trust.
This guide maps the GSC and GA4 signals we use to tell decline from progress at the URL level. You get a decision table for refresh now versus monitor another cycle, examples of how metrics combine in practice, and a short list of portfolio metrics that keep the conversation honest in leadership reviews. It complements our content analytics metrics overview without repeating the full glossary.
If you already run a decay monitoring workflow, treat this as the scoring layer. The workflow finds which URLs to inspect. These metrics tell you whether the story is decay, growth, or noise. Most teams can score a Tier 1 list in under two hours once the spreadsheet template exists.
What “decay” and “growth” mean on a single URL
Content decay is a sustained loss of search visibility, engagement, or business value on a page that used to perform. It is rarely one bad week. It is a pattern: impressions drift down, clicks follow, query mix shifts, or visitors who arrive engage less and convert less often.
Content growth is the opposite pattern on a URL that is gaining or holding ground: rising or stable impressions on target queries, clicks and CTR improving or holding at strong levels, engaged sessions and conversions trending up or steady at a level that justifies investment.
Both states show up in the same tools. The mistake is reading one metric in isolation. A page can show growth in clicks while decaying in query breadth. Another can show falling impressions while conversions hold because the remaining traffic is more qualified. Context from content analytics practice, not a single KPI, decides the label.
Why one metric is never enough
Search Console and GA4 each tell half the story. GSC shows how often Google shows your URL and how often searchers click. GA4 shows what happens after the click. Business outcomes may live in your CRM, but the early warning system is almost always a blend of search and on-site behavior.
Teams get burned when they:
- Watch rankings only. Average position can hold while impressions and clicks fall.
- Watch pageviews only. Traffic from email or paid can mask organic decay on a URL.
- React to one month. Seasonality, SERP tests, and site changes create single-month spikes and dips.
- Ignore query mix. The head keyword can look fine while supporting queries drift away.
Our pageviews-to-decisions measurement framework sits one level above URL metrics. This article stays at the URL layer: which signals mean refresh, which mean wait, and which mean double down.
GSC metrics that signal content decay
Google Search Console is the first place decay appears for most B2B sites. Export by page and by query monthly. Compare the same 28-day window to the prior period and, when you can, to the same period last year.
Impressions trending down
Falling impressions mean Google is showing your URL less often for the queries in the report. On a priority URL, two consecutive months of meaningful decline (often 15% or more for Tier 1 pages, tuned to your volume) is a decay flag unless you can explain seasonality or a deliberate de-index.
Clicks falling faster than impressions
When clicks drop while impressions are flat or only slightly down, the problem may be snippet appeal, SERP features, or competitors winning the click at similar visibility. That is still decay in outcomes even if “rankings” look stable. Pair with CTR change at similar position bands.
CTR down at similar position
A drop of one point or more in CTR while average position is unchanged suggests title, meta, or SERP layout issues. Fix snippets before you rewrite the body. If CTR stays weak after a snippet test, treat it as content relevance decay.
Average position sliding on primary queries
Export top queries per URL. Decay often hits long-tail variants before the head term moves. When your primary commercial query slips two or more positions for two months, the page is losing the comparison against fresher or more complete competitors.
Query mix drift
When the vocabulary of top queries changes (informational replaces commercial, unrelated terms appear, buyer-intent phrases drop off), Google may be reinterpreting the page. That pattern is decay even when total impressions look flat. Save query lists monthly for Tier 1 URLs so you can see drift.
GSC metrics that signal content growth
Growth is not “everything green.” It is improvement on metrics tied to intent and business value.
- Impressions up on target queries without a proportional position drop (you are earning more real estate for terms you want).
- Clicks and CTR up together on priority URLs, especially after a refresh or snippet test with a documented hypothesis.
- Stable or improving position on head and supporting queries while impression share grows.
- Query mix tightening toward commercial and problem-aware phrases you optimized for.
A post that gains impressions from irrelevant queries is not growth you want. Filter growth by whether new queries match the page’s job in the funnel. A how-to that starts ranking for unrelated celebrity news is a quality signal problem, not momentum.
GA4 metrics that signal content decay
GA4 confirms whether search visibility problems show up on the page and in downstream events.
- Organic sessions down on the URL month over month, aligned with GSC click trends.
- Engaged sessions down or engagement rate falling: visitors who arrive are less satisfied or the audience mix changed.
- Scroll and time-on-page softening where you track them, especially on long guides.
- Key events down (demo requests, newsletter signups, asset downloads) tied to the URL as a landing page.
- New user share from organic falling on a page meant to attract new demand.
When GSC clicks fall and GA4 engaged sessions fall together, you have a strong decay case. When GSC clicks fall but conversions hold, investigate snippet and SERP issues first. When GSC looks fine but GA4 engagement falls, the page may still match queries but no longer match reader expectations.
GA4 metrics that signal content growth
Growth on-site looks like qualified traffic doing more of what you want.
- Organic sessions and engaged sessions up in parallel over two or more months.
- Key event rate stable or up while volume grows (scale without dilution).
- Return visits from organic on educational hubs you intend to be references.
- Assist paths showing the URL more often in journeys that convert, even when last-click credit is modest.
Connect GA4 landing page reports to the same URL list you tier in Search Console. Different tools, same rows. That join is what makes content measurement actionable instead of decorative.
Decision table: refresh now vs monitor vs invest
Use this table on Tier 1 URLs after you join GSC and GA4 for the same two 28-day windows. Adjust thresholds to your traffic; low-volume pages need looser rules.
| Pattern (GSC + GA4) | Likely read | Action |
|---|---|---|
| Impressions down, clicks down, engaged sessions down | Decay (visibility + relevance) | Refresh now — body, examples, structure; check competitors |
| Impressions flat, clicks down, CTR down, position similar | Snippet or SERP decay | Snippet test first; refresh if CTR does not recover in 4 weeks |
| Impressions down, clicks flat, conversions stable | Query mix or visibility shift; may still serve niche well | Monitor one cycle; deep query review |
| Impressions up, clicks up, engaged sessions up, events up | Growth | Invest — internal links, expand sections, repurpose |
| Impressions up, clicks flat, engagement down | Wrong audience or weak on-page match | Diagnose intent; tighten page or adjust targeting |
| Two or more decay flags, two months running | Sustained decay | Refresh or consolidate; do not defer again |
| Single metric dip one month only | Maybe noise | Monitor; note external events (migration, update) |
One flag means watch. Two aligned flags on a high-value URL mean act this month. Three flags mean the URL should not wait behind net-new content with lower revenue impact.
How to read metrics together on one URL
Walk through a worked example. A B2B SaaS comparison post ranked well for eighteen months. Month one: impressions down 12%, clicks down 18%, CTR down 0.8 points, position down 0.4 (noise-level). Month two: impressions down 22% vs baseline, clicks down 31%, engaged sessions down 25%, demo assists from that URL down 15%. Query export shows fewer “vs” and “pricing” variants and more vague informational phrases.
That is decay, not a snippet-only blip. The team schedules a full refresh: updated pricing tables, new screenshots, sharper H2s, links to newer product pages. They skip a title-only test because engagement decay confirms the body is stale too.
Contrast with a glossary page: impressions up 40%, clicks up 10%, CTR down sharply, engaged sessions up, conversions flat. Growth in reach with a snippet problem. Title and meta test first. If CTR recovers, the page moves to “invest” with internal links from newer posts.
Write a one-line diagnosis in your spreadsheet: “Visibility + engagement decay, two months” or “Reach growth, CTR lag.” That sentence drives the action column.
Portfolio metrics beyond the URL row
Leadership reviews need aggregates. Track a small set each quarter:
- Health rate: share of Tier 1 URLs with zero decay flags.
- Decay backlog: count and average age of URLs flagged but not actioned.
- Refresh win rate: percent of refreshed URLs that improved clicks or key events within 60 days.
- Growth inventory: URLs with two or more growth signals you have not yet amplified with links or expansion.
If win rate is low, your refresh playbook is cosmetic. If backlog age grows, you are measuring without capacity. Both are operational fixes, not excuses to buy another dashboard.
Metrics tied to content decay vs growth in AI answers
Classic GSC and GA4 still matter, but teams also watch whether key URLs appear in AI-generated answers and whether those mentions are accurate. Manual prompt checks monthly on your highest-value questions supplement search metrics. A URL can show GSC growth while losing citation share to a competitor’s clearer definitions.
Treat AI visibility as a qualitative overlay until your tracking matures: cited, mentioned without link, absent, or wrong. Wrong is urgent. Absent on commercial prompts while GSC decays confirms the page is losing relevance across surfaces. Growth in traditional metrics plus stable accurate citations is the combined picture you want.
Common misreads that waste refresh budget
- Refreshing on pageviews alone without checking organic source and query mix.
- Calling seasonality decay without year-over-year comparison.
- Ignoring assisted conversions on educational posts that rarely last-click close.
- Chasing impressions from irrelevant queries as growth.
- Cosmetic updates (date stamp only) when engagement and query data say the substance is stale.
When a post stopped ranking abruptly, read our guide on improving old blog posts that stopped ranking alongside this metric lens. Sudden drops sometimes need technical or structural fixes, not another paragraph.
Set baselines so decay and growth are comparable
Metrics only mean something relative to a baseline. Pick baselines once and reuse them so month-over-month reviews do not turn into arguments about date ranges.
- Rolling 28-day windows aligned to how Search Console reports, compared to the prior 28 days and the same window last year when history exists.
- Tier 1 URL list frozen for the quarter unless a major launch adds or retires pages. Changing the list every month makes trend lines meaningless.
- Primary query per URL documented in your sheet so position slides are measured against the term that matters, not an average diluted by long-tail noise.
- Event definitions in GA4 locked before you score decay. A tracking change looks like engagement collapse if nobody notes the migration.
Store baseline exports. When a stakeholder asks why you refreshed a post in August, you can reopen June and July cells and show two months of aligned flags. Without baselines, every refresh looks reactive.
Build the URL scorecard in one spreadsheet
You do not need a custom BI tool on day one. One spreadsheet with one row per Tier 1 URL and columns for each metric window is enough to answer what metrics show content decay vs growth for the pages that matter.
- Export GSC performance by page for window A and window B.
- Export GA4 organic landing page metrics for the same URLs and windows.
- VLOOKUP or INDEX/MATCH on URL path normalized the same way in both tools (trailing slashes trip joins).
- Calculate percent change for impressions, clicks, CTR, position, sessions, engaged sessions, and key events.
- Apply flag rules from the decision table. Write diagnosis and action in the last columns.
Add a tab for growth candidates: URLs with two or more growth signals not yet actioned. Marketing teams often over-index on decay and forget to feed winners with internal links while they still have momentum.
Second worked example: growth masked by sitewide noise
A services firm saw flat sitewide organic traffic for two quarters. Leadership assumed content was stalled. URL-level scoring told a different story. Four pillar pages showed impression and click growth on target queries. Twelve mid-tail posts showed decay. Two legacy pages consumed refresh budget in prior years but contributed almost no pipeline.
The team paused refreshes on low-tier legacy URLs, doubled internal links into the four growing pillars, and scheduled three refreshes only on commercial posts with two-month decay patterns. Sitewide traffic still moved slowly, but pipeline-attributed sessions from content rose because work followed the metric story, not the homepage chart.
Sitewide aggregates are for context. URL scorecards are for decisions.
Connect metrics to decay monitoring and refresh
Metrics without a cadence become screenshots in a slide deck. Tie URL-level decay vs growth reads to a monthly review: export, join, flag, diagnose, assign owner. The output is a ranked refresh queue and a short growth list for internal linking and expansion.
Pages in sustained decay belong in the same roadmap as net-new content. Pages in growth deserve amplification while momentum exists. That prioritization is how content decay work stays connected to revenue instead of living in an SEO side channel.
Document “monitor” decisions with the metric that almost triggered action. Next month you will not re-debate from memory. You will compare to the same cells in the sheet.
Turn decay vs growth signals into a clear content plan
The point of asking what metrics show content decay vs growth is not academic. It is to stop guessing which posts deserve work this month. When impressions, clicks, engagement, and query mix tell the same story on a Tier 1 URL, that story should appear on your calendar with a name attached.
If you want help mapping GSC and GA4 to a tiered URL list, flag rules, and a monthly review format your team will actually run, we offer content analytics audits that end with a prioritized 90-day plan tied to your data, not generic benchmarks.
Content decay and growth metric questions
Clear answers on which GSC and GA4 signals mean decline, momentum, or wait another month before you refresh.
What metrics show content decay vs growth?
At the URL level, decay usually shows up as sustained declines in Search Console impressions and clicks, falling CTR at similar positions, sliding rankings on priority queries, query mix drift away from buyer intent, and matching drops in GA4 organic sessions, engaged sessions, and key events. Growth is the opposite pattern: rising or stable visibility on target queries, improving clicks and CTR, tightening query relevance, and stronger on-site engagement and conversions without dilution.
No single metric defines either state. Read GSC and GA4 together for the same URL over at least two monthly cycles before you label decay or growth and assign refresh, monitor, or invest actions.
Which GSC metrics best indicate content decay?
Watch impressions, clicks, CTR, average position, and query-level changes together. Falling impressions with stable or worse position suggests visibility loss. Clicks falling faster than impressions points to snippet or SERP issues. Query mix drift (commercial terms replaced by vague or unrelated queries) is an early decay signal even when totals look flat.
Export top queries per URL monthly for Tier 1 pages. Decay often appears in long-tail variants before the head keyword moves.
Which GA4 metrics confirm decay on a landing page?
Filter organic traffic to the URL and compare month over month: sessions, engaged sessions, engagement rate, scroll depth if tracked, and key events tied to that landing page. Align GA4 trends with GSC click trends. When both fall, decay is likely in visibility and on-page relevance. When GSC clicks fall but conversions hold, test titles and meta before a full rewrite.
Include assisted conversion paths for educational content that rarely gets last-click credit but still influences pipeline.
When should you refresh content vs monitor another month?
Refresh when a high-priority URL hits two or more decay signals for two consecutive months, when facts or examples are outdated, or when competitors clearly outrank you on the same intent. Monitor when only one metric dipped once, especially after migrations, algorithm chatter, or known seasonality. Try snippet tests first when position is strong but CTR dropped.
Use a written decision table so monitor decisions are explicit and you compare the same metrics next cycle instead of debating from memory.
How do content metrics differ from site-wide traffic?
Site-wide traffic hides URL-level decay. Heroes and campaigns can mask softening posts that still matter for pipeline. Tier your URLs by business value and score decay vs growth per URL. Portfolio metrics (health rate, decay backlog age, refresh win rate) summarize the system; URL metrics drive weekly work.
A flat sitewide chart with a decaying cluster of commercial posts is a common leadership surprise without URL-level scoring.
What metrics show content growth worth investing in?
Look for impressions and clicks rising on target queries, CTR stable or improving, engaged sessions and key events growing in parallel, and query mix aligning with commercial or problem-aware intent. Growth worth investment gets internal links from newer content, section expansions, and repurposing while momentum is visible in the data.
Impression growth from irrelevant queries is not investment-grade growth. Filter by intent fit before you amplify.
How do decay vs growth metrics connect to content refresh?
Metrics select candidates; refresh hypotheses explain what you will change. Before editing, note which signals triggered action and what you expect to move (clicks, CTR, engaged sessions, events). Review 30 and 60 days later against that note. Low refresh win rate means updates are too cosmetic or the wrong URLs are chosen.
Pair metric reads with competitor and SERP checks so refreshes address intent gaps, not just dates and adjectives.
Can a page show growth in clicks but still be decaying?
Yes. Clicks can rise from broader or off-intent queries while commercial queries and conversions soften. Query-level exports and event rates expose that split. Similarly, a page can decay in AI citation share while classic GSC metrics look stable. Use multiple surfaces and query intent, not one green column, before you call a URL healthy.
Label the diagnosis in your tracker so the team does not confuse volume growth with strategic growth.