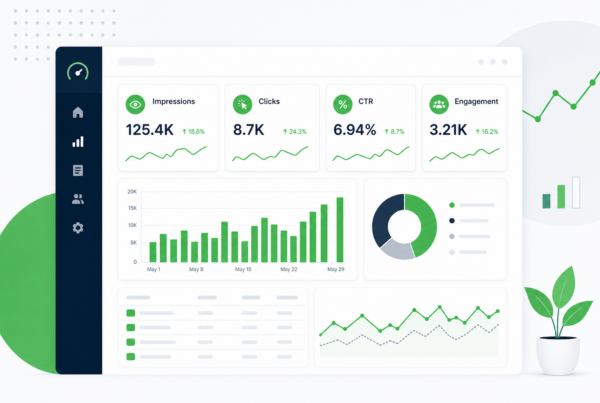
Your analytics dashboard says traffic is up. Pageviews climbed again last month. Someone forwards the screenshot to leadership with a thumbs-up emoji. Then someone else asks the question that actually matters: what should we do differently because of this?
Silence. Pageviews do not answer that question. They tell you how many times a page loaded. They do not tell you whether the right people read it, whether it moved someone closer to a sale, or which post deserves a refresh this quarter. That gap is why we keep seeing teams with full GA4 setups and no real content analytics practice. The data is there. The decisions are not.
This post lays out a simple content measurement framework we use with B2B marketing teams: four layers of metrics, each tied to a specific decision you can make. Not a dashboard wish list. A way to go from pageviews to a short list of actions you can defend in a meeting.
Why pageviews stop being useful
Pageviews made sense when blogs were mostly top-of-funnel traffic machines. Publish, rank, get visits, hope something sticks. That model still has a place, but it breaks down fast once you need to justify content spend, prioritize refreshes, or explain why one pillar post matters more than another.
Pageviews lump everything together. A bot hit counts the same as a qualified buyer reading your pricing comparison. A bounce from the wrong keyword counts the same as a deep read from someone who later fills out a form. They also reward volume over fit. A thin listicle on a broad term can out-pageview a detailed guide that actually closes deals.
None of this means you should ignore traffic. It means traffic is a starting signal, not a decision signal. The shift is from “how many people saw this?” to “what did this content change?” That second question needs a framework, not a bigger chart.
What a measurement framework actually does
A content measurement framework is not a list of every metric GA4 can export. It is a map from data to decisions. Each layer answers one question, uses a small set of metrics, and produces a specific output: fix this page, refresh that cluster, write more on this topic, stop funding that format.
Good frameworks share three traits. They are layered, so you do not jump from pageviews to revenue and wonder why the line does not connect. They are repeatable, so the same review works every month without reinventing the analysis. And they are honest about what you can and cannot prove, especially in long B2B sales cycles where last-click attribution will lie to you.
What a framework is not: a reason to buy another tool before you have a monthly review habit. What it is: a shared language for marketing, sales, and leadership so “content is working” means something concrete.
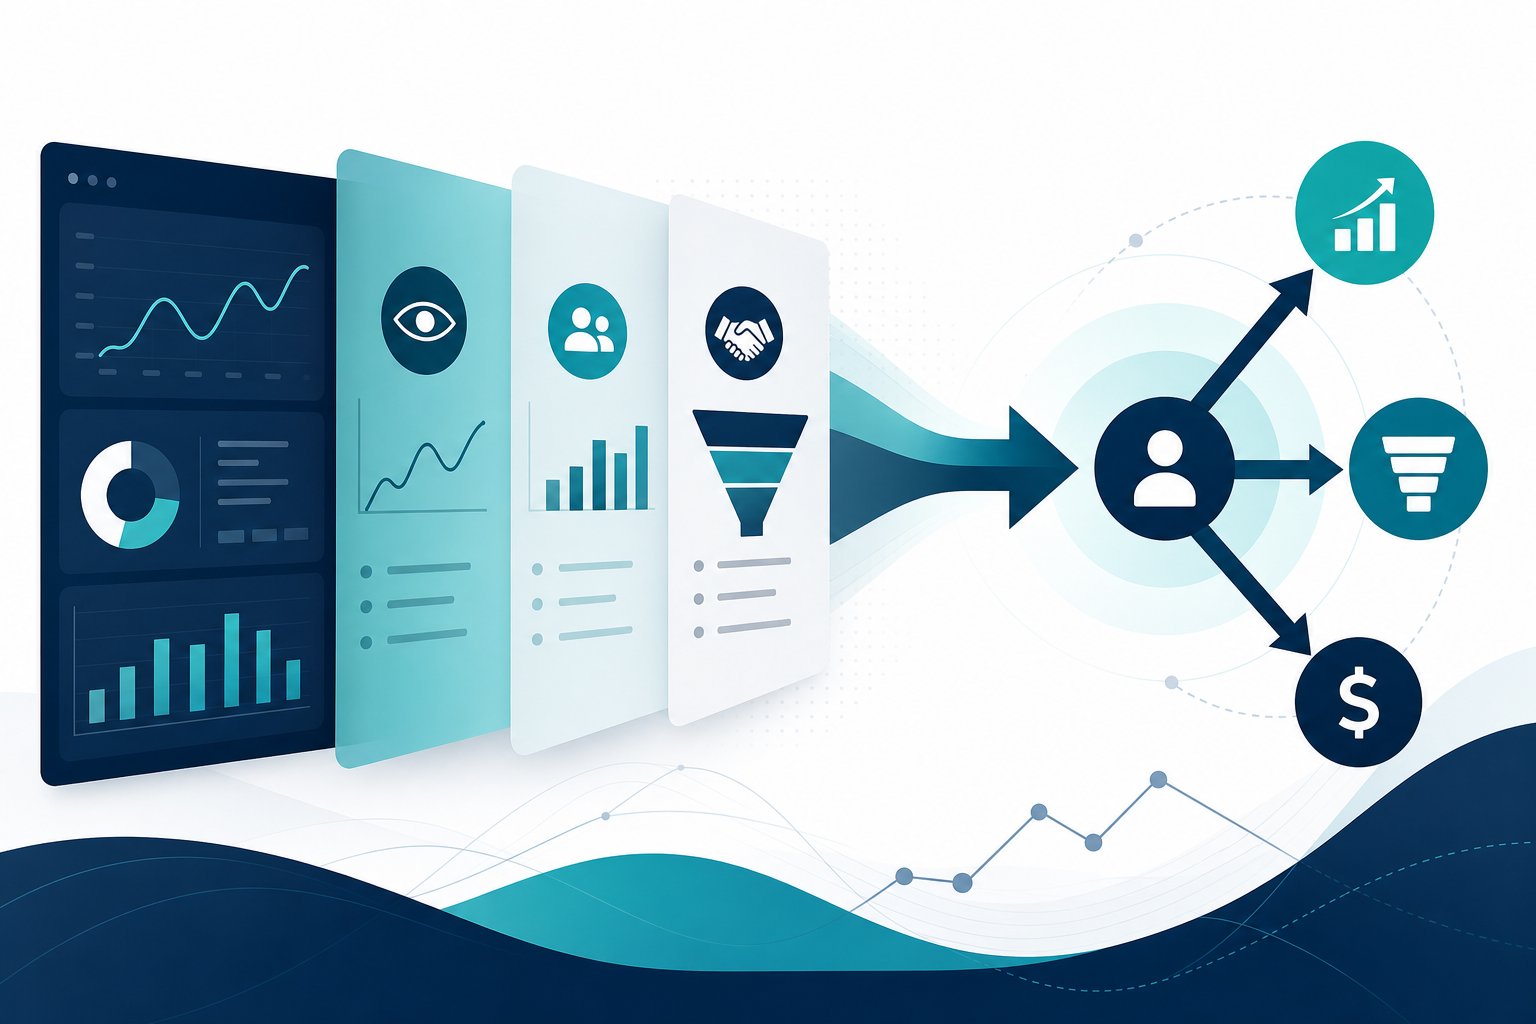
The four-layer decision stack
We organize content measurement into four layers. Think of them as a stack, not a funnel. A post can score well on one layer and poorly on another, and that mismatch is often the insight.
- Layer 1 — Visibility: Are the right people finding this content?
- Layer 2 — Engagement: Are they getting value once they arrive?
- Layer 3 — Influence: Is this content showing up on the path to pipeline?
- Layer 4 — Outcomes: Did it contribute to business results you care about?
Each layer feeds the next, but you make different decisions at each one. Visibility problems get SEO and distribution fixes. Engagement problems get structure and copy fixes. Influence problems get topic and funnel alignment fixes. Outcome problems get budget and strategy fixes.
The rest of this post walks through each layer with the metrics we actually watch, what decision each metric triggers, and how to run the stack in a monthly review without drowning in exports.
Layer 1: Visibility — are the right people finding it?
Visibility is where most teams already live. Search Console impressions and clicks. Average position by query. Organic sessions by landing page. Referral traffic from email or social. These numbers tell you whether your content is in the game.
The decision at this layer is simple: is this page being seen by people searching for what it actually covers? High impressions with low clicks often means your title and snippet are not earning the click, or you rank too low to matter. Low impressions with strong engagement later (we will get to that) means the page converts attention but needs more distribution.
We pair Search Console with GA4 landing page reports and look for the gap between the two, which is exactly what we covered in our guide on impressions vs clicks in Search Console. Visibility without clicks is a billboard in a basement. Clicks without visibility growth is a page that works but never scales.
Practical visibility checks each month:
- Top 20 pages by impressions: any with CTR well below what their position should earn?
- Top 20 pages by clicks: any losing clicks while impressions hold? Early content decay signal.
- New pages from the last 90 days: indexing, impressions, and first clicks on pace?
Decision output from Layer 1: a list of pages to rewrite titles on, pages to strengthen for ranking, and pages to deprioritize because they attract the wrong queries.
Layer 2: Engagement — are they getting value after the click?
Clicks get people in the door. Engagement tells you whether they stayed long enough for the content to do its job. This is where pageviews finally become useful, but only in context: not how many, but what happened after.
We watch scroll depth on long posts (via GA4 events or a tool like Microsoft Clarity), average engagement time per page, and key events you define: PDF downloads, calculator use, video plays, clicks to related hub pages. For B2B blogs, a strong signal is whether readers move to a second page on the same topic cluster, not whether they read one post and leave.
Low engagement on a high-traffic page is a content problem, not a traffic problem. The topic may be right but the structure is wrong: wall of text, weak intro, no clear next step. High engagement on a low-traffic page is often your best refresh candidate. The hard part is done. People who find it stay.
Set engagement benchmarks by content type, not site-wide. A 3,000-word guide should not share the same engagement time target as a 600-word news post. Compare pages to siblings in the same cluster.
Decision output from Layer 2: pages to restructure, internal links to add, sections to cut, and formats to replicate because they hold attention.
Layer 3: Influence — is content on the path to pipeline?
This is the layer most dashboards skip, and it is where B2B teams win or lose the argument for content investment. Influence metrics ask: did this content touch someone before they became a lead, joined an opportunity, or entered a sales conversation?
Last-click attribution will tell you content “does not convert” because the form page or pricing page gets final credit. That is not how B2B buying works. Someone reads three posts, attends a webinar, then requests a demo. Content was there. Your CRM may not show it unless you wire the connection.
Starter influence signals you can track without a data warehouse:
- Assisted conversions in GA4: which pages appeared in the path before a key event, even if they were not last click.
- CRM source fields: “how did you hear about us” and UTM-tagged links from content CTAs.
- Content-tagged form fills: hidden fields or landing page variants that record which article sent the visitor.
- Sales call themes: reps noting which posts prospects mention (manual, but honest).
You will not get perfect multi-touch attribution on day one. You will get directionally correct answers: this pillar post keeps showing up before demos, this category of post never appears in won deals. That is enough to shift budget.
For a deeper pass on which numbers belong in the stack, see our breakdown of content analytics metrics. Influence sits between engagement and revenue, and it is the bridge leadership usually wants to see.
Decision output from Layer 3: topics to double down on, posts to add stronger mid-funnel CTAs, and top-of-funnel pieces that educate well but never connect to a next step.
Layer 4: Outcomes — did it move the business?
Outcomes are the numbers your CFO recognizes: qualified leads, pipeline created, revenue influenced, cost per opportunity from organic content. This layer is messy in B2B because cycles are long and sample sizes are small. That is not an excuse to skip it. It is a reason to use ranges and trends, not single-post ROI claims.
We track outcome metrics at the cluster level more often than the post level. Did our content analytics hub collectively influence more demo requests this quarter than last? Did posts refreshed under our living content program show improved assisted conversions after republish?
Monthly, pick one outcome metric your leadership already cares about and connect content to it. If leadership cares about SQLs, report how many SQLs had a content touch in the prior 90 days. If they care about pipeline, report influenced opportunity value from organic-sourced contacts. One metric, consistently reported, beats a sprawling deck nobody trusts.
Decision output from Layer 4: continue, pause, or reallocate content investment; which hubs earn more production time; whether refresh work is paying off in influenced pipeline, not just traffic recovery.
If you are not sure which outcome metric to start with, ask what decision leadership is already trying to make. If the question is “should we keep funding the blog?”, tie content to influenced pipeline or SQL count. If the question is “which topics work?”, compare outcome proxies by cluster: demo requests, trial signups, or sales conversations that mention a content path. One metric, tracked the same way every month, builds trust faster than a new KPI every quarter.
Mapping metrics to decisions (quick reference)
When you are staring at a spreadsheet and need to know what to do, this table is the shortcut. Match the pattern to the layer, then take the action.
| What you see | Layer | Likely cause | Decision |
|---|---|---|---|
| High impressions, low clicks | Visibility | Weak title/snippet or low rank | Rewrite SERP copy or improve ranking |
| High clicks, high bounce, low engagement time | Engagement | Intent mismatch or poor structure | Align intro to query; restructure page |
| Strong engagement, low impressions | Visibility | Good page, weak distribution | Internal links, refresh for SEO, promote |
| Strong engagement, never in conversion paths | Influence | Top-funnel only, no next step | Add CTA, link to mid-funnel content |
| Traffic up, pipeline flat | Outcomes | Wrong topics or weak funnel bridge | Shift topics toward buyer intent |
| Clicks falling, impressions stable | Visibility | Decay or SERP competition | Refresh or consolidate content |
Keep this table near your monthly review. The goal is not to classify every page perfectly. It is to stop treating all green arrows as success.
Running a monthly review that produces decisions
A framework only works if it runs on a schedule. Here is the loop we use, roughly two hours for a mid-size B2B blog, less once the exports are templated.
- Pull Layer 1 data (30 min): Search Console last 90 days by page; note impression/click gaps and position changes.
- Pull Layer 2 data (20 min): GA4 engagement by landing page; flag high-traffic/low-engagement and low-traffic/high-engagement outliers.
- Pull Layer 3 data (30 min): Assisted conversions or CRM-influenced contacts tied to content URLs; note which clusters appear in paths.
- Check Layer 4 (20 min): One outcome metric vs prior period; cluster-level, not every post.
- Write the decision list (20 min): Five pages or clusters max, each with one action and which layer triggered it.
Share the decision list, not the raw exports. Leadership does not need 40 screenshots. They need: “We are rewriting three titles, refreshing two decaying pillars, and adding demo CTAs to four posts that engage well but never appear in SQL paths.”
Quarterly, zoom out: are the same pages on the list every month? That means your fixes are not sticking, or you are measuring the wrong thing. Both are worth a deeper audit.
The minimum tool stack (you probably already have it)
You do not need a $50k analytics suite to run this framework. Most teams already have the core pieces.
- Google Search Console for Layer 1 visibility.
- GA4 for Layer 2 engagement and starter Layer 3 assisted paths.
- Your CRM (HubSpot, Salesforce, etc.) for Layer 3 and 4 when UTMs and source fields are clean.
- A spreadsheet or Looker Studio for the monthly decision list until you outgrow it.
Add Clarity or a heatmap tool when engagement questions keep coming up and GA4 averages hide the story. Add a proper attribution tool when CRM data is clean enough to deserve it. Sequence matters. Process first, tooling second.
When the numbers disagree
Layers will conflict, and that is useful. A page with soaring pageviews, weak engagement, and no pipeline touch is probably ranking for the wrong queries or promising something the body does not deliver. A page with modest traffic, strong engagement, and repeated assisted conversions is a keeper even if it will never be your top URL.
When Search Console says a page is winning and GA4 says everyone bounces, trust the on-page experience first but verify intent match. When GA4 says engagement is fine but sales never hears about the post, you have an influence gap: add paths to demo content, case studies, or contact pages.
Traffic drops deserve a separate pass. If sitewide clicks are sliding, work through visibility and decay before you blame content quality. Our guide on why website traffic is dropping walks through that diagnostic order.
Common mistakes that create noise, not action
- Reporting pageviews to leadership. They will ask “so what?” and you will not have an answer.
- Chasing one metric per post. Clusters and programs matter more than individual URLs in B2B.
- Skipping Layer 3 because attribution is hard. Imperfect influence data beats no influence data.
- Building dashboards before defining decisions. Start with the decision list template, then automate what repeats.
- Treating all content types the same. Benchmark guides against guides, not against news posts.
- Ignoring AI and answer-engine visibility. Visibility now includes whether your content is cited in AI answers, not only blue links. Factor that into Layer 1 planning as search surfaces split.
Turn your metrics into a decision list
Pageviews are fine for spotting motion. They are not fine for choosing what to do next. The four-layer stack gives you that choice: visibility fixes, engagement fixes, influence fixes, and outcome checks, each with its own metrics and its own output. Run it monthly, cap your action list at five items, and content analytics stops being a reporting chore and starts steering the calendar.
If you want help wiring Search Console, GA4, and your CRM into one prioritized decision list, we build that review with teams who are tired of dashboards that do not change what they publish next.
Content measurement framework: common questions
Quick answers on moving beyond pageviews, what to track at each layer, and how often to run the review.
What is wrong with using pageviews as a primary content metric?
Pageviews count every load, regardless of who visited or what they did next. They treat a bot the same as a qualified buyer, and a bounce from the wrong keyword the same as a deep read. They are useful for spotting traffic trends, but they do not tell you whether content is reaching the right audience, holding attention, or influencing pipeline. For decisions, you need layered metrics tied to specific actions.
Teams that report only pageviews to leadership often struggle to answer “what should we change?” because the number has no built-in next step. Use pageviews as one visibility signal among several, not as the scoreboard.
What is a content measurement framework?
A content measurement framework is a structured way to connect content data to decisions. Instead of tracking every available metric, you organize measurement into layers (visibility, engagement, influence, outcomes) and define what action each layer triggers. The output is not a dashboard; it is a prioritized list of what to fix, refresh, promote, or stop funding.
Good frameworks are repeatable: the same monthly review works every cycle without reinventing the analysis. They also acknowledge limits, especially in B2B, where last-click attribution undercounts content that appears earlier in long sales cycles.
What metrics should a B2B marketing team track for blog content?
At minimum: Search Console impressions, clicks, CTR, and position for visibility; GA4 engagement time, scroll or key events, and bounce rate by landing page for engagement; assisted conversions or CRM-tagged content touches for influence; and one outcome metric leadership already uses (SQLs, pipeline influenced, or demo requests) reported at the cluster level.
You do not need twenty metrics. You need four layers with one or two numbers each that answer a clear question and produce a clear action. Expand the stack only when the monthly review consistently produces decisions and you need more granularity.
How do you connect blog posts to pipeline without perfect attribution?
Start with directional signals: GA4 assisted conversion paths, UTM parameters on content CTAs, hidden form fields that capture referring article, and CRM source or “how did you hear about us” fields filled by sales. Ask reps which posts prospects mention on calls. None of this is perfect, but patterns emerge quickly: certain pillars appear repeatedly before demos while others never show up in won deals.
Perfect multi-touch attribution can come later when your data hygiene supports it. Directional influence data is enough to shift topic priorities and justify refresh work on posts that sit in conversion paths.
How often should you review content performance?
Run the full four-layer review monthly for most B2B marketing sites. Use a 90-day window in Search Console and GA4 to smooth weekly noise. Cap your action list at five items so the team actually executes. Quarterly, step back and ask whether the same pages keep appearing on the list, whether outcome trends are moving, and whether your clusters need structural changes beyond page-level fixes.
Weekly spot checks on new publishes are fine, but the strategic review that changes the editorial calendar should not be ad hoc. Put it on the calendar the same way you would a campaign retrospective.
What is the difference between engagement metrics and influence metrics?
Engagement metrics describe on-site behavior after the click: time on page, scroll depth, clicks to related content, downloads, video plays. They answer whether the reader got value from the piece itself. Influence metrics describe relationship to downstream actions: appearing in a conversion path, getting tagged in a CRM contact, or being cited by sales on a call. They answer whether the content played a role in moving someone toward a business outcome.
A post can engage well and still fail on influence if it has no path to mid-funnel content or a clear next step. That mismatch is one of the most common findings in a first framework audit.
Can a small marketing team run this framework without expensive tools?
Yes. Search Console and GA4 are free. Your CRM already holds pipeline data if UTMs and source fields are used consistently. A spreadsheet for the monthly decision list is enough to start. Add heatmaps or a BI tool when the same questions repeat and manual exports eat too much time.
The bottleneck is usually process, not software. Teams with enterprise dashboards but no monthly decision ritual see less action than teams with a simple stack and a fixed review meeting.