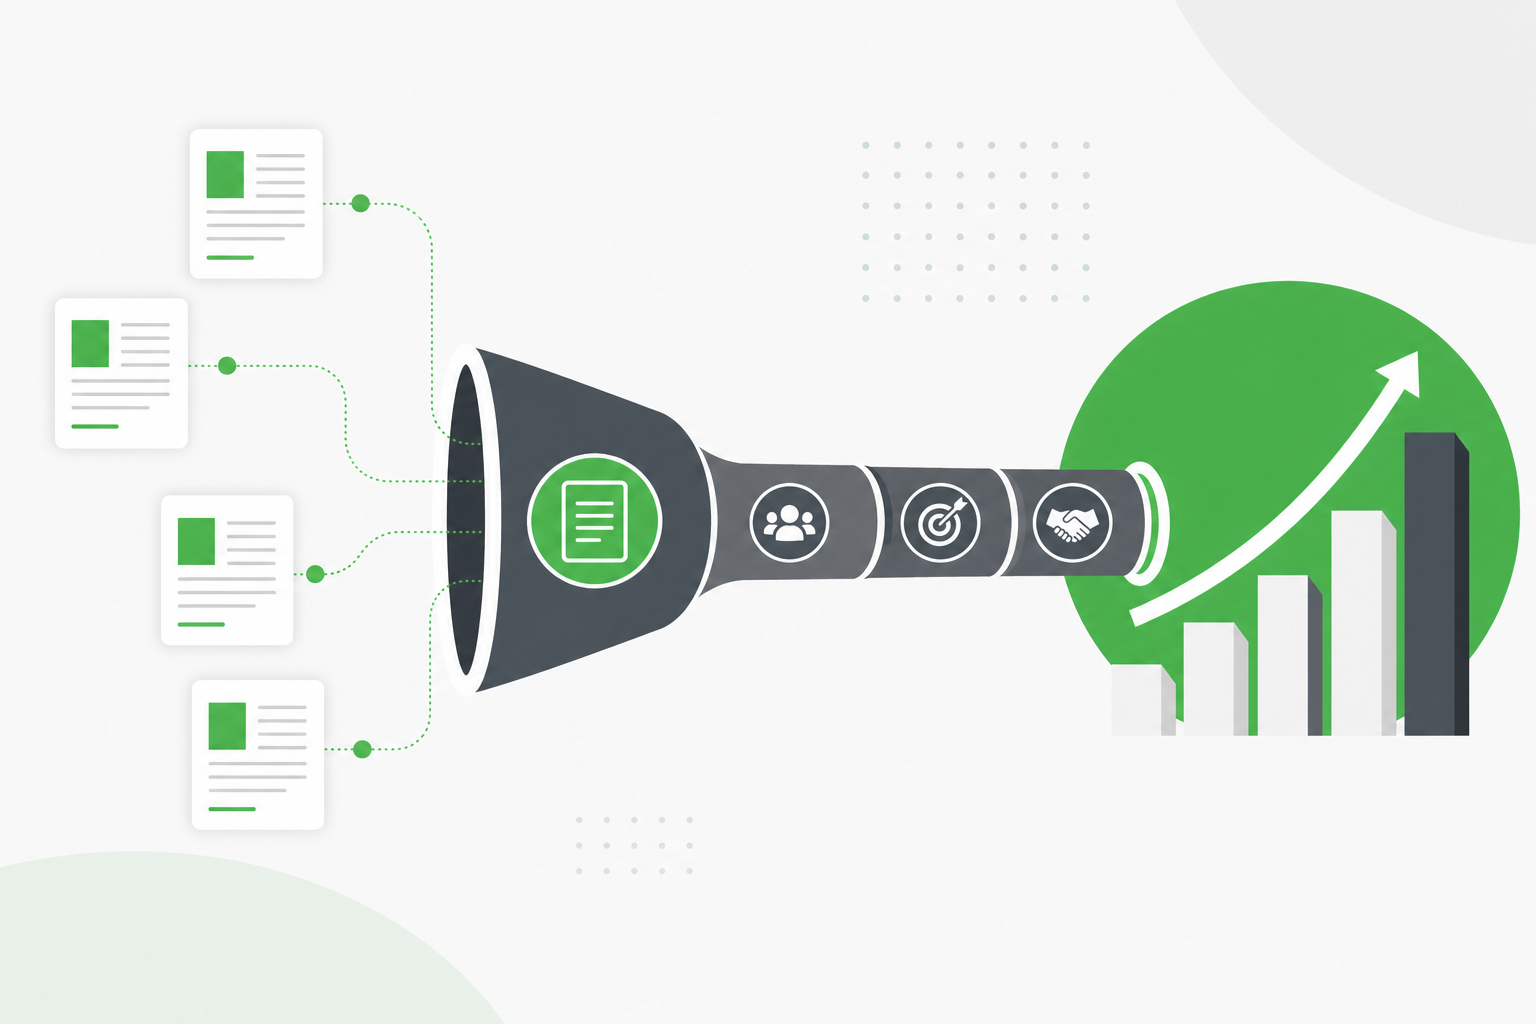
Your blog had a record month for pageviews. Leadership still asked why pipeline flatlined. That disconnect is normal in B2B, and it is exactly why content analytics for B2B has to look different from a media or ecommerce playbook. Long sales cycles, multiple stakeholders, and research-heavy buying paths mean the post that “converted” on last-click reporting is rarely the post that started the deal.
This guide shows how to tie content to pipeline without pretending one metric tells the whole story. You will see which numbers to demote, which to promote, and how to build a scorecard marketing and sales both recognize. If you are building a broader measurement program, start with our hub on content analytics and the metrics deep dive on content analytics metrics, then use this post for the B2B pipeline layer.
Why B2B content measurement breaks the usual rules
B2B buyers rarely read one blog post and fill out a demo form twenty minutes later. They search over weeks, share links internally, return on different devices, and sometimes only convert after a sales call references an article someone else found. Last-touch attribution makes content look weaker than it is because the final click often goes to pricing, a branded search, or a direct visit.
Stakeholder complexity adds noise. A practitioner downloads your checklist. Their director reads the pillar post. Procurement never touches the blog but asks for security documentation linked from it. Dashboards that only count form fills on the same session miss most of that influence.
Finally, B2B content often serves education before intent is obvious. Top-of-funnel posts should not be judged by demo conversion rate alone. You need a tiered model: some metrics prove reach and trust, others prove pipeline participation, and a few prove revenue influence when CRM data allows.
Vanity metrics that waste leadership meetings
Vanity metrics are not useless. They become a problem when they are the only story you tell executives. These are the usual suspects on B2B marketing sites:
- Total blog pageviews without segmenting by topic, funnel stage, or ICP fit
- Social shares and likes when your buyers do not discover vendors on social
- Ranking count (“we rank for 500 keywords”) without revenue or pipeline relevance
- Time on page on long guides where deep reading is expected but not tied to next steps
- Publication velocity as proof of progress when quality and refresh lag
- Newsletter subscribers without open and click trends or sales follow-up rates
These numbers can sit on a secondary activity slide. They should not headline the content analytics story when a VP asks how blogging affects pipeline. Replace them with metrics that connect to buyer motion: influenced contacts, assisted conversions, brand search lift, and engagement on pages that precede form fills in multi-touch paths.
When impressions climb and clicks stall, that is not vanity. It is a actionable findability signal. Treat impressions vs clicks as a diagnostic metric, not a bragging metric.
Pipeline-linked metrics that actually matter
Pipeline-linked metrics answer: did this content help a buyer move closer to a conversation worth having? Start with what your stack can support today, then tighten tracking over two quarters.
Influenced contacts and opportunities
Mark CRM contacts or deals where a blog URL appears in first-touch source, last-touch source, or a custom “content influenced” field sales agrees to use. Even manual tagging on closed-won deals builds a library of posts that show up in real wins.
Assisted conversions in analytics
GA4 and HubSpot can show paths where a blog post appeared before conversion even if it was not the landing page. Assisted conversion reports are imperfect but directional. They stop you from killing top-of-funnel posts that rarely finish the journey alone.
Conversion rate by landing page (with caveats)
Last-touch landing page conversion rate still matters for bottom-funnel content: comparison pages, implementation guides, ROI calculators. Use it where intent is high; do not use it to judge awareness posts.
Brand search growth
Rising branded queries in Search Console often lag behind content that built trust. Pair brand search trend with new contacts listing “Google search” and your brand name. It is a coarse signal, but executives understand it.
Engagement on high-intent URLs
Track engagement rate and key events on pages with demo CTAs, pricing adjacency, or integration comparisons. A spike in traffic means little if engagement and form starts drop.
Map content to buyer stages
Pipeline metrics only make sense when content is labeled by stage. You do not need a perfect taxonomy on day one. Tag posts as top, middle, or bottom funnel in your CMS or spreadsheet.
Stage-appropriate expectations:
| Stage | Example content | Primary metrics | Pipeline metrics (secondary) |
|---|---|---|---|
| Top | Industry trends, “what is” guides, problem education | Organic reach, engagement, internal link depth | Assisted conversions, brand search, return visits |
| Middle | Frameworks, comparisons, checklists | Engagement, downloads, email capture | Influenced contacts, multi-touch paths |
| Bottom | ROI models, implementation, vendor selection | Form fills, demo requests, sales page clicks | Opportunity creation, win rate on influenced deals |
Review each stage monthly. If top-funnel posts earn reach but never appear in assisted paths, improve internal links and CTAs toward middle-funnel hubs. If bottom-funnel posts convert but get no traffic, fix findability before rewriting copy.
CRM setup: influenced contacts without over-engineering
You do not need a full attribution rebuild to start. Minimum viable CRM linkage for B2B content:
- Pick one required field on contact or deal create: “How did you hear about us?” with options that include specific content types or URLs when possible.
- Sync key form submissions to CRM with landing page URL and referrer.
- Train sales to note content mentioned on discovery calls in a single text field.
- Monthly export of contacts created with blog in first-touch or notes field until automation exists.
HubSpot users can start with original source drill-down and contact property reports filtered by first page seen. Salesforce teams often use campaign members or custom UTM fields on lead records. The tool matters less than consistent capture.
When sales skips fields, metrics collapse. Make the field small, optional at first, then required once reps see win stories tied to content tags.
Assisted conversions and multi-touch honesty
Assisted conversions give credit to touchpoints that appeared in the path before conversion. In GA4, explore paths that include blog paths before key events. In HubSpot, use attribution reports with linear or U-shaped models if configured.
Be honest in leadership readouts:
- Multi-touch models are directional, not accounting-grade.
- Models differ by platform; do not merge HubSpot and GA4 numbers without translation.
- Small sample sizes on long-cycle deals produce volatile month-over-month swings.
Still, assisted data prevents classic B2B mistakes: cutting the pillar post that appears in 40% of paths because last-touch landing pages are always pricing. Show both views when you present. Last-touch for bottom-funnel optimization; assisted for portfolio decisions on top and middle content.
Brand search and return visits as demand signals
When buyers research a category, they read several vendors’ blogs. When they remember yours, brand search rises. Track branded query impressions and clicks in Search Console quarter over quarter. Filter out navigational junk if your brand name is ambiguous.
Return visitors on key URLs (GA4 new vs returning) show whether content earns a second look. A middle-funnel guide with high returning users often feeds sales conversations even when forms are sparse. Mention those URLs in sales enablement: “When you hear objection X, send them this post.”
Pair brand search with pipeline lag in mind. Content published in Q1 may move brand search in Q2 and opportunities in Q3. Use rolling 90-day windows, not single-month panic.
Align content analytics with sales without another meeting series
Sales and marketing fight over metrics when each team uses different definitions. Keep alignment lightweight. Share a five-slide readout monthly, not a new standing meeting.
Slide one: three posts with rising assisted paths or CRM mentions. Slide two: one post that ranks well but never appears in deals (candidate for CTA or stage repositioning). Slide three: brand search trend. Slide four: one refresh win with before and after clicks. Slide five: next month’s content bets tied to gaps sales reported in a shared form.
Ask sales for one input channel only: a form, Slack message, or CRM note template. “Objection or question you heard twice this month” is enough to feed content planning. Reciprocate with the hot list of URLs worth sending mid-deal.
When a rep says a post helped close, document it in a shared doc with deal size band and industry, not only in anecdote. Over a year, those stories become the executive narrative that protects budget better than a pageview chart.
Engagement metrics that predict sales conversations
Some on-site behaviors correlate with pipeline better than pageviews alone. Watch for:
- Sequential page paths: blog post to pricing to contact in one session or within seven days
- High engagement on comparison or integration posts
- Repeat visits to the same cluster (read three posts in one topic hub)
- Calculator or tool usage embedded in content
- PDF or checklist downloads followed by form fills
Configure GA4 events for these actions once, then reuse them in explorations and dashboard tiles. Microsoft Clarity session replays help validate whether engagement is meaningful reading or idle tab time.
Share a short “content hot list” with sales each month: URLs with rising return visits and strong engagement on bottom-funnel neighbors. That handoff turns analytics into conversation starters.
Reporting content ROI to leadership without overselling
Executives want ROI language. B2B content rarely produces clean ROAS like paid search. Frame ROI as risk reduction and pipeline efficiency instead of same-quarter revenue multiples.
A credible executive summary includes:
- Three posts or clusters with documented influence on opportunities (stories, not only numbers)
- Brand search trend vs last year
- Cost per influenced opportunity if you know content program spend
- Refresh wins: URLs where updated content recovered clicks or form starts
- Honest gaps: topics competitors own that you have not covered
Avoid claiming content “generated $X revenue” unless finance signs off on attribution rules. Say content “appeared in X% of closed-won paths this quarter” when CRM notes support it. That precision builds trust and protects the program when vanity metrics dip.
Build a B2B content scorecard
Consolidate pipeline-linked metrics into one scorecard reviewed monthly. Example rows:
- Organic clicks to blog (90-day trend)
- Assisted conversions including blog paths
- CRM contacts with content influence tag
- Demo or contact form rate on bottom-funnel posts
- Brand search clicks (quarterly)
- Refresh queue completion (operational, ties to living content)
Score each green, yellow, or red against targets you set once per year. Targets should differ by stage: top-funnel greens on reach and assisted paths; bottom-funnel greens on conversion rate and influenced opps.
Review the scorecard in the same meeting where you assign refresh work. Pipeline metrics without action items become another slide deck. Every red or yellow cell should have an owner or a tracking fix dated within thirty days.
Keep the scorecard on one page. Link out to GA4, GSC, and CRM for detail. If a metric cannot be owned by someone on the team, remove it until tracking exists.
When pipeline data says kill a post (and when it does not)
Not every low-converting post deserves the axe. Use a short decision tree before you deprioritize or noindex content.
Document the outcome in your scorecard notes so quarterly reviews show whether cut or keep decisions paid off. If you merged a post and pipeline mentions disappeared, that is a signal to restore or redirect differently.
- Check funnel stage. Top-funnel posts should not be judged by demo rate alone.
- Check assisted paths. If GA4 or HubSpot shows the URL in 15%+ of conversion paths, protect it even when last-touch conversion is zero.
- Check sales mentions. If reps still send the link, the post is sales enablement even when analytics look soft.
- Check findability. Low traffic on a strong bottom-funnel post is often an SEO or internal link problem, not a topic problem.
- Check ICP fit. Traffic from wrong industries inflates pageviews without pipeline potential. Filter or rewrite instead of cutting blindly.
When all five checks say the post underperforms for your ICP and never assists conversions, merge it into a stronger hub, redirect, or archive. Document the decision in your refresh queue so the team does not relitigate it six months later.
Connect measurement to refresh and hub strategy
Pipeline analytics fail when they ignore decay. A post that influenced deals last year may slip in rankings today. Fold Search Console trend and engagement decay into the same review where you read CRM influence data.
When a high-influence URL loses clicks, prioritize refresh over net-new volume. When a high-traffic URL never influences pipeline, test CTA placement, add middle-funnel links, or accept it as pure SEO reach with lower sales priority.
Hub pages deserve special attention. They anchor clusters that feed long research cycles. Seasonal updates and internal link maintenance on hubs protect pipeline influence across many spokes. Treat hub performance as a cluster metric: hub plus child posts, not isolated URLs.
For decay diagnosis and recovery options, see our guide on content decay and connect those workflows to your B2B scorecard.
Common B2B content analytics mistakes
- Judging all posts by demo conversion rate and starving top-of-funnel work
- Letting sales skip CRM fields then declaring content has no pipeline impact
- Comparing content to paid ads on last-touch ROAS without matching attribution windows
- Ignoring sales cycle length in monthly reports
- Chasing traffic topics outside ICP because impressions looked easy
- Building dashboards nobody reviews while requesting more metrics
Fix the process before adding tools. A monthly meeting with six trusted metrics beats a forty-chart dashboard that sales never sees.
If you are early in analytics maturity, pick one bottom-funnel post and one top-funnel pillar each quarter. Instrument both fully, review them in every monthly scorecard, and use them as teaching examples before you scale the program sitewide.
Tie posts to pipeline your team can act on
B2B content analytics is not about proving every blog post closed a deal. It is about knowing which posts participate in buyer journeys, which hubs need investment, and which vanity numbers distract from those answers. Build stage-aware expectations, capture influenced contacts honestly, and pair last-touch with assisted views when you talk to leadership.
If your reporting still stops at pageviews while sales asks for proof, we help teams connect GA4, Search Console, and CRM data into scorecards and refresh priorities that match how B2B buyers actually research. Start with one scorecard, one monthly review, and three posts you can trace to conversations worth having.
The first version will be messy. That is fine. Directional pipeline truth beats waiting six months for perfect attribution while leadership assumes the blog does nothing.
B2B content analytics and pipeline: common questions
Answers on tying blog posts to pipeline, avoiding vanity metrics in executive reports, and setting up CRM and analytics views for long B2B sales cycles.
How do you tie blog content to B2B pipeline?
Combine last-touch landing page conversions for bottom-funnel posts with assisted conversion paths in GA4 or HubSpot for top and middle-funnel content. Capture influenced contacts in CRM with first-touch URL, form landing page, or a field sales fills after discovery calls.
Tag posts by funnel stage so expectations match: reach metrics for top-funnel, assisted paths and downloads for middle, demo and opportunity influence for bottom. Review monthly with sales input on which posts appear in live deals.
What content metrics matter most for B2B marketing?
Organic clicks and engagement on ICP-relevant topics, assisted conversions including blog paths, CRM contacts or opportunities with content influence, conversion rate on high-intent landing pages, brand search trend, and return visits to key guides. Pageviews alone rarely satisfy pipeline questions.
Pair quantitative metrics with a short list of win stories where specific posts appeared in closed deals. B2B buyers need narrative proof alongside charts.
Why is last-click attribution wrong for B2B content?
B2B buyers research over weeks and touch many URLs before converting. Last-click credit usually goes to pricing, branded search, or direct visits even when a blog post started the evaluation. Cutting content based on last-touch alone often removes posts that assist most deals.
Use last-click for optimizing bottom-funnel pages and assisted or multi-touch views for portfolio decisions on educational content. Present both to leadership with clear limitations.
What are vanity metrics in B2B content analytics?
Vanity metrics when used as headline KPIs include total blog pageviews, social shares, keyword count rankings, publication volume, and time on page without stage context. They show activity but not pipeline participation.
Keep them on secondary slides if needed. Lead executive readouts with influenced contacts, assisted conversions, brand search, and refresh wins tied to URLs sales recognizes.
How long does B2B content take to affect pipeline?
Often one to three quarters depending on sales cycle length. Top-funnel content may move brand search and return visits first; opportunity creation lags. Use 90-day rolling windows and compare year over year to avoid reacting to single-month noise.
Align reporting cadence with sales cycle: monthly tactical reviews, quarterly strategic readouts for leadership. Note publication dates when interpreting influence data.
How do you report content ROI to B2B executives?
Frame ROI as pipeline efficiency and influence, not same-quarter revenue unless finance approves attribution rules. Show posts or clusters appearing in closed-won paths, brand search trend, cost per influenced opportunity if known, and refresh recoveries on priority URLs.
Avoid claiming precise revenue from blog posts without agreed methodology. Use language like appeared in X percent of influenced paths when CRM data supports it.
What is a B2B content scorecard?
A one-page monthly summary of six to eight metrics: organic blog clicks, assisted conversions with blog in path, CRM influenced contacts, bottom-funnel conversion rate, brand search clicks, and refresh queue progress. Each metric gets a green, yellow, or red status against annual targets that differ by funnel stage.
Link to GA4, Search Console, and CRM for detail. Assign an owner for each metric so gaps in tracking get fixed instead of debated in meetings.